VCMap 3.0 Users Manual
Software developed by Steve Davis, Bio::Neos Inc. To Reference the software, please cite: Koltes J.E., Davis S.G., Hu Z-L., Shimoyama M., Dwinell M., Kwitek A.E., and J.M. Reecy. (2012). Virtual Comparative Map (VCMap): A comparative genomics tool designed to facilitate cross-species annotation. (submitted; Journal info to be updated). VCMap software development was funded by USDA grant USDA-NRI 2007-04187. |
For more information related to server, design, development, and other related issues, see the project site.
I. Introduction
A. VCMap objectives
VCMap was built to facilitate genomic visualization that enables discovery of genetic elements responsible for quantitative trait variation. The guided user interface (GUI) provides chromosomal level views optimized for quantitative trait locus (QTL) visualization and comparison of QTL across species. With these goals in mind, the software and backend database were built to share as many different types of annotation across species as possible. To allow integration of annotation and QTL across species, a trait ontology (Vertebrate Trait Ontology, VTO) (3) is used to allow users to select related phenotype annotations to meet these goals. The GUI is also designed to allow users to load their own private annotations and genomics data to facilitate information comparison across species to meet the ultimate researcher-driven goal of comparative genomics.
B. Using VCMap - what it was designed to do (and not do)
VCMap can be used for many tasks such as: comparing QTL across species, viewing evolutionary rearrangements across species, comparing genome builds within species, comparing different map types within species, and so on. VCMap was designed to fill a gap in the need for genomics viewers to compare QTL and annotations across species at a chromosomal level with multiple map types. VCMap does not make comparisons at the sequence level as many existing browsers already achieve this task (i.e. Ensembl genome browser, UCSC genome browser), but links are provided to these databases to allow users to access sequence level data. So why use VCMap? VCMap provides a unique comparative view across multiple individuals at the chromosomal level. It has been built with multiple features that allow researchers to customize comparative views across species. For example, users can view synteny/homologue blocks and homology lines across species for specific regions while hiding other, less interesting portions of the chromosome. VCMap also delivers more options to view annotations, QTL and private data, and selected subsets of this information that most other viewers cannot accommodate. Moreover, since VCMap operates on the user’s desktop as Java WebStart application, it insures no private data is shared over the web, making your data visualization more secure than web browser based viewers.
C. Supported Species and Maps
VCMap supports the following species within the current version of the database: Cow, Chicken, Horse, Human, Mouse, Pig, Rat.
The types of maps supported within VCMap include: genomic (sequence based), genetic (linkage based) and radiation hybrid (RH). Gene annotations are available from NCBI, Ensembl, and the rat genome database (RGD). QTL annotations are obtained from animal QTLdb and RGD (2, 4). For more details on these specific data sources, see:
Animal QTLdb: http://www.animalgenome.org/QTLdb/
Ensembl: http://www.ensembl.org/index.html
NCBI: http://www.ncbi.nlm.nih.gov/gene
RGD: http://rgd.mcw.edu/
Database statistics on the number of STS, genes and QTL present in each of the currently supported species are listed at http://www.animalgenome.org/VCmap/stats.php
D. Basis for comparative mapping- data sources
Homology information is gleaned from homologene at NCBI (5) and represented by blue connecting lines in the GUI. Homologene links require common annotation across species allowing the genes to be identified as homologues. Synteny and homology information at the chromosomal level is obtained from the UCSC new conservation track (level 1) (1). These sequence-based comparisons from UCSC define the anchors to allow cross-species comparisons across physical maps. Linkage and physical maps are connected based on positions of markers sequences (STS) as recorded at UniSTS at NCBI. The RH maps are mapped to genomic assemblies based on the alignment of STS markers on both maps. Linkage and RH maps are only linked to other maps if they contain STS markers that also exist on those maps. For more information about these data sources, please see:
Homologene: http://www.ncbi.nlm.nih.gov/homologene
UniSTS: http://www.ncbi.nlm.nih.gov/unists
UCSC Genome Browser: http://genome.ucsc.edu/index.html
E. Frequently Asked Questions (FAQ) for VCmap
If you are getting started with VCmap and have some basic questions, a quick look at our FAQ page may help you get started with your VCmap analysis. The FAQ is available at http://www.animalgenome.org/VCmap/faq.php
II. Getting Started: GUI Instructions and Tutorial
Besides the instructions and examples provided here, an automated tutorial and detailed help section is included within the VCMap GUI. The tutorial can be started by selecting help in the menu and clicking on the tutorial option to launch a new window with the guided tutorial. More details on the help and tutorial are provided below in section II, part J.
A. Acquiring and Starting to run the software
Before running the GUI, make sure you have the required software on your computer
FIGURE 1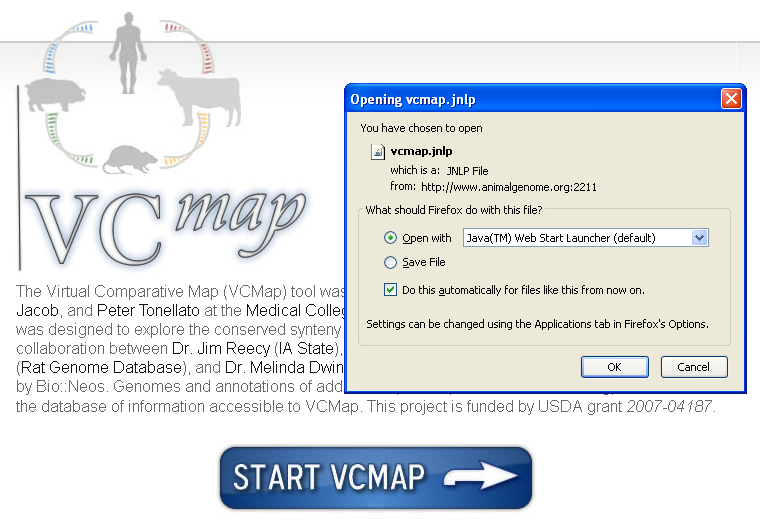
|
If you need to install Java, it can be downloaded from http://java.com/en/download/index.jsp
When first launching the VCMap software, click on the button labeled “Start VCMap” on the webpage above. With most browsers, you should be prompted to either open or save the application. Clicking on open will automatically launch the software with Java WebStart. You may have to indicate to your browser that you would like to open the launch file (JNLP file) with the Java WebStart application. If so, you will need to browse your local file system and select the Java WebStart application from the location in which the Java Runtime Environment was installed. While the application launches, you should be prompted with a pop-up box asking if you would like to grant permission for the application to access some of your local resources: click “allow” at this point. This should start the GUI and the automated tutorial. For future use, you can return to the website, or you can save the .jnlp file for VCMap anywhere on your computer so that you can simply open the software by double-clicking on the .jnlp program icon. If you experience problems running the GUI, see the troubleshooting section, or visit the following link to request help. VCmap help: http://www.animalgenome.org/bioinfo/services/helpdesk.
Note, when multiple map builds are available: comparisons across maps are often limited to a single build that is supported at NCBI and UCSC. In the case where a build does not allow comparisons across all species, you can first compare builds within species to allow cross-species comparisons. To do this, first load the build supported at NCBI and UCSC, followed by the other builds and species of interest.
C. Features for Viewing Maps:
VCMap was built with considerable flexibility in viewing map comparisons. Within the GUI, the following options will assist users searching for specific map features.
FIGURE 2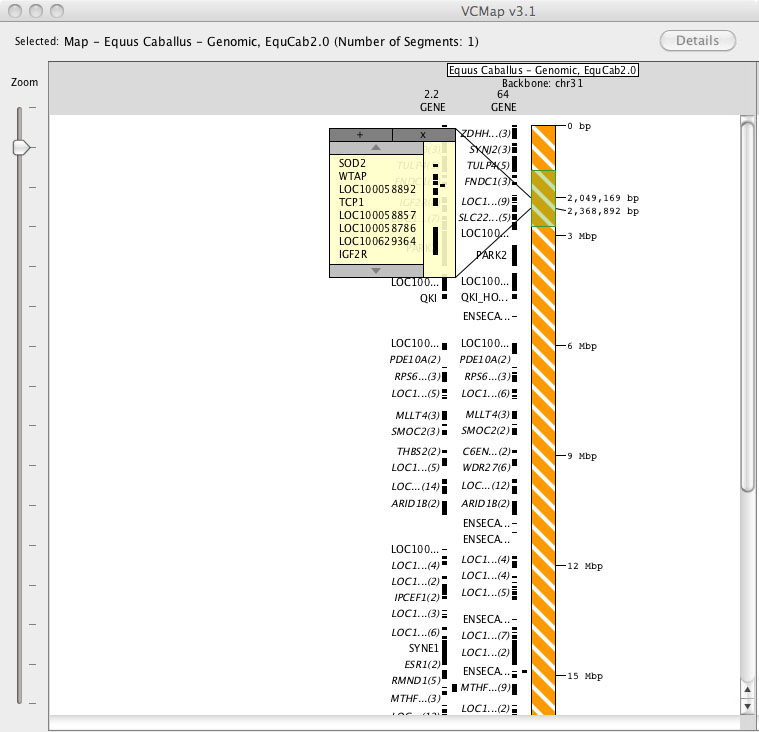
|
2. Viewing more gene annotations, without zooming in: When viewing maps at the lowest resolution (highest level zoomed-out), users can click on annotations to produce a pop-up box that will allow viewing of all of the underlying annotations (Figure 2). This allows viewing of all annotations within a region without the need to zoom in.
5. Annotation details: To see more detailed information about an annotation feature, users can select the feature with a mouse click, or select a group of features with a click and drag over the feature names. Once selected, there will be a blue detail box surrounding those features. Now clicking the “Details” button in the upper right hand of the information will open the annotation details dialog. Each tab in the annotation details dialog provides details for each of the selected features. Additionally, each annotation pop-up box provides links to external data sources to allow additional information mining. The annotation details dialog can be opened with a double click on a single feature as well.
FIGURE 3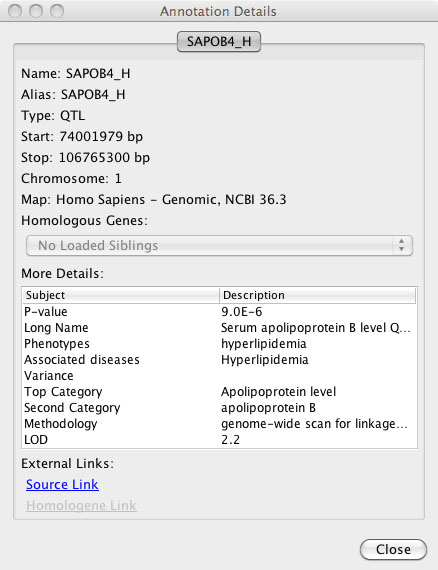
|
Specific annotation detail windows include different information depending on which species, map and annotation is loaded. Although all of these details are not listed in each annotation details window, here is a list of possible information that can be obtained from the detail windows. These details include: Feature Name, Aliases, Type [Feature Type], Start position, Stop position, Chromosome, Map [type and build information], Homologous Genes (in other loaded maps, if applicable), and additional feature specific information for genes (NCBI, Ensembl, or RGD), STS (NCBI) or QTL (Animal QTLdb, or RGD). External web links to the source data are provided in each case. When Homologene information is available, an additional link is included to the associated data at NCBI. Custom annotations loaded from file will include details on: feature Name, Aliases, Type of annotation (format), Start position, Stop position, Chromosome and Map type with which the data is aligned. Additional associated details depend on the file format. For example, GFF or VCF formatted data will include associated information which is included in the annotation details box.
6. Custom Views: The VCMap GUI accommodates a wide range of options for viewing maps. A summary of the viewing options includes:
a) Hiding or Unhiding features
b) Edit viewing preferences: Under the file menu, selecting the file option, selecting the “edi preferences” option allows users to alter viewing options under the following tabs.
General: Marker name displayed, show map units, frequency of unit labels.
Markers: The name of a marker type to be displayed can be selected and the color of this display can be altered.
Connections: Allows connections between adjacent and non-adjacent maps to be turned on and off and also for connections to be turned on even when no map segments are selected.
Tutorial: Defines if a user wants the tutorial to be shown at start-up.
Logging: Allows users to turn on log file tracking and record errors to file and a debugging record this will be useful for future software fixes and obtain helps from developers.
c) Adjusting map positions back to the default: To show all features as intended by default, within the file menu select “restoredefaults” within the “edit preferences” option. This can particularly helpful when customized settings make it difficult to view features on the map.
8. New Viewing Window: To open a new viewing window with the VCMap GUI, go to the File menu and select “New Window”new window”.
D. Viewing Homology
VCMap allows viewing of homologous genes and syntenic gene blocks wherever source information from NCBI and UCSC is available. This section defines how homology and synteny are viewed in VCMap.
1. Viewing Homology with Connecting lines: Three types of connecting lines are rendered across maps. These lines are drawn in different colors to indicate different meanings, including:
grey lines: indicate direct or homologous relationships across maps. These can be features that are mapped to multiple maps (for example an STS marker that has been mapped to a physical map) or features that have been identified as homologous by NCBI HomoloGene or some other data source.
blue lines: Gray lines become blue whenever a feature involved in the relationship is selected by clicking on the feature or clicking and dragging around the feature.
green lines: indicate the boundaries of selected regions based on synteny and homology information available through UCSC track-one net.
For example, see Figure 4A and B. In the case where syntenic blocks are available to define cross species comparisons, but no homologene links are available, connecting lines across species cannot be rendered.
FIGURE 4A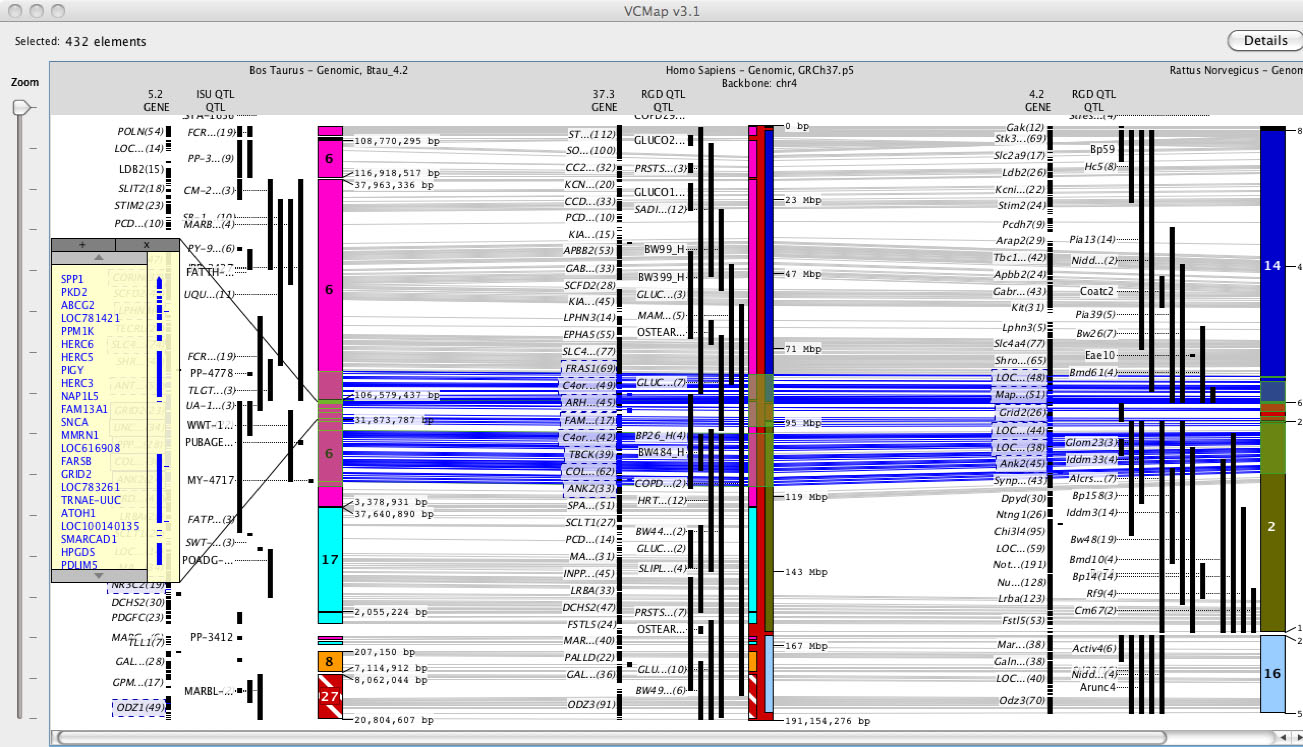
|
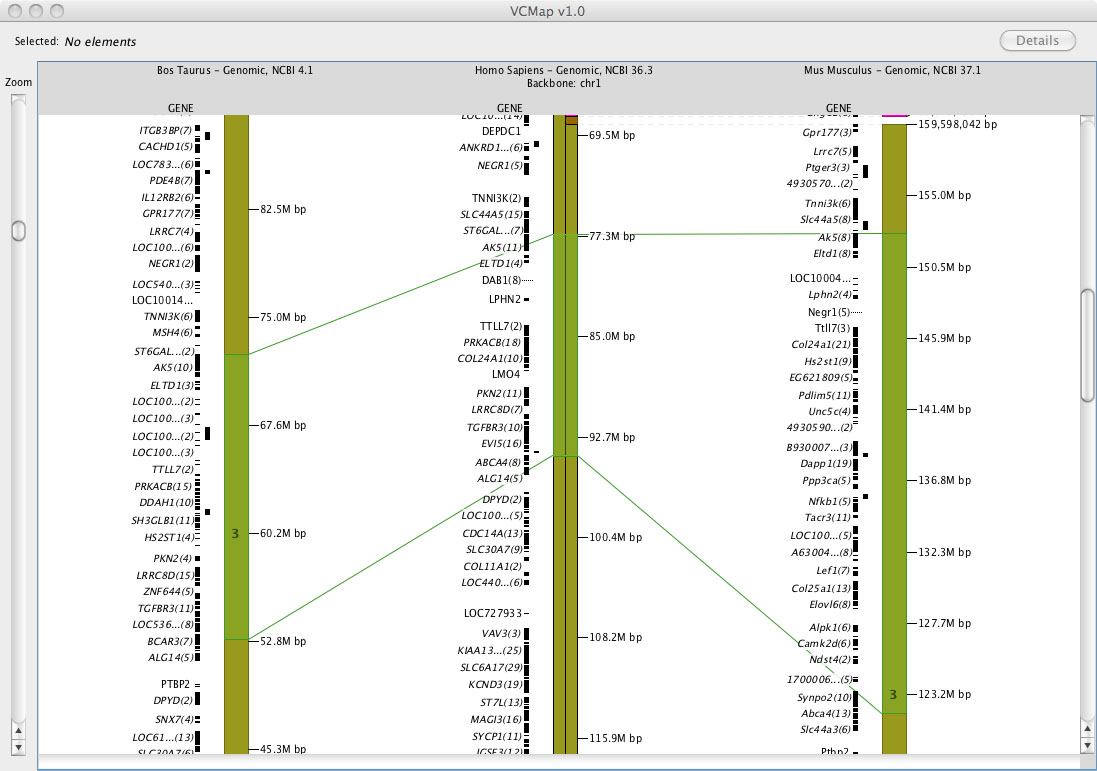
2. Viewing Synteny: Synteny is defined in VCMap by colored blocks that represent chromosomal segments in the off-backbone map compared to the backbone map. (e.g. See the backbone chromosome in Figure 4A). Different colored regions represent different syntenic chromosomal blocks within the off-backbone species. Synteny blocks visualized horizontally aligned to the backbone map, and are scaled and inverted as appropriate. In order to more easily visualize the alignment, a small indicator is placed on top of the backbone chromosome as well (as shown on the Human chromosome in Figure 4A).
|
|
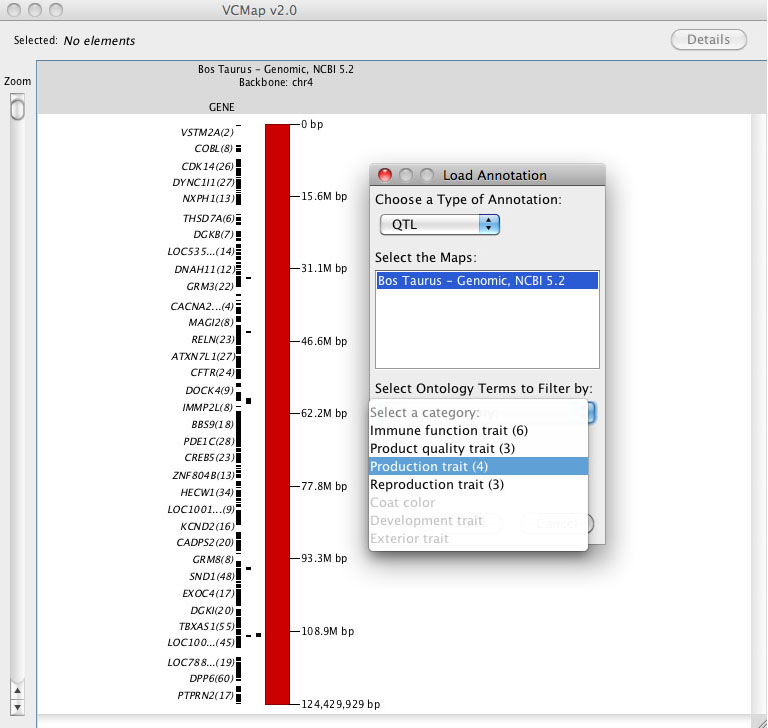
E. Loading Annotation and using the ontology features
FIGURE 6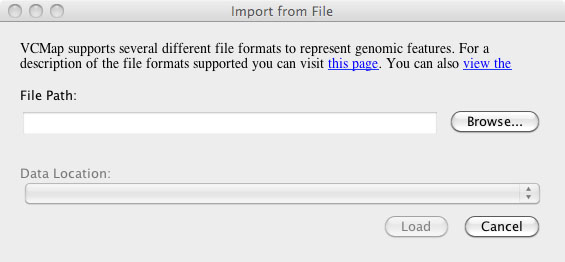
|
F. Loading Custom Annotation/ Private Data
Users can load their own private data and annotations by using the annotation option on the tool bar and selecting “Import annotation from File . . . ” followed by “import from file” (Figure 6). After selecting “import from file”, a dialog is launched that allows users to browse for their file. he application attempts to automatically determine the appropriate map to align the data against based on the contents of the file, but may require the user to specify the map for which the data should be visualized.
1. Accepted Data formats include: BAM, BED, GFF, SAM, TXT, or VCF.
2. Limitations: Data and annotations can only be loaded to maps that correspond to the locations within the data/ annotation file.
G. Downloading Annotation data
I. Exporting publication grade images
FIGURE 7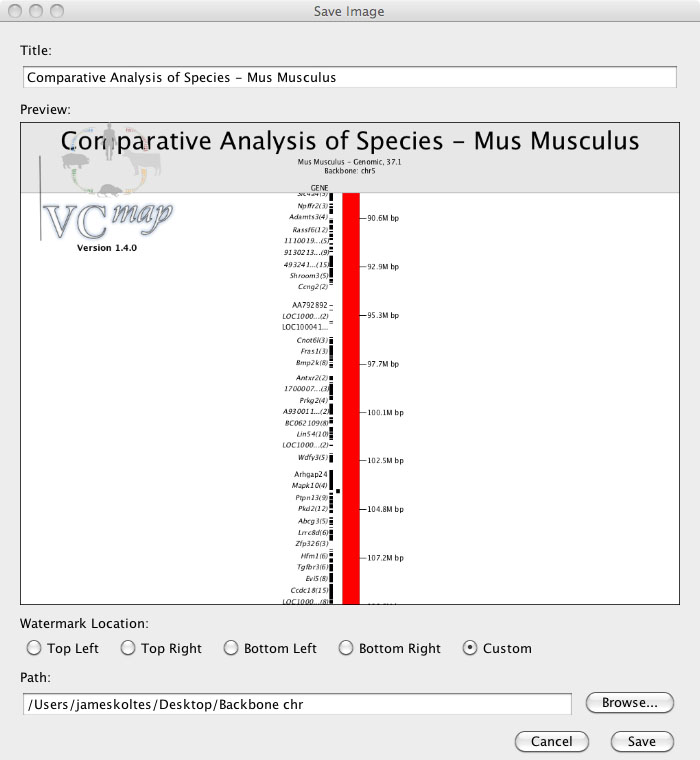
|
Users can export images of the visualization of the data that they have produced by loading and manipulating data in the VCMap application. This feature is accessed by selecting “Export Image . . ” from the File menu (Figure 7). A dialowill be shown in which users can modify the title of their image, choose the resolution level,select the image size to be exported, and location to save their image file. Images can be exported at four resolution levels from suitable for screen viewing (72dpi) to very high quality suitable for printing (600dpi).
J. Help and the Automated Tutorial
VCMap has a help menu that allows users to search for specific information (e.g. Figure 8), pull up a table of contents with features (e.g. Figure 9) or turn on the automated tutorial (Figure 10). The automated tutorial when launched from the help menu can help users through the entire process of loading and viewing maps and annotations.
|
|
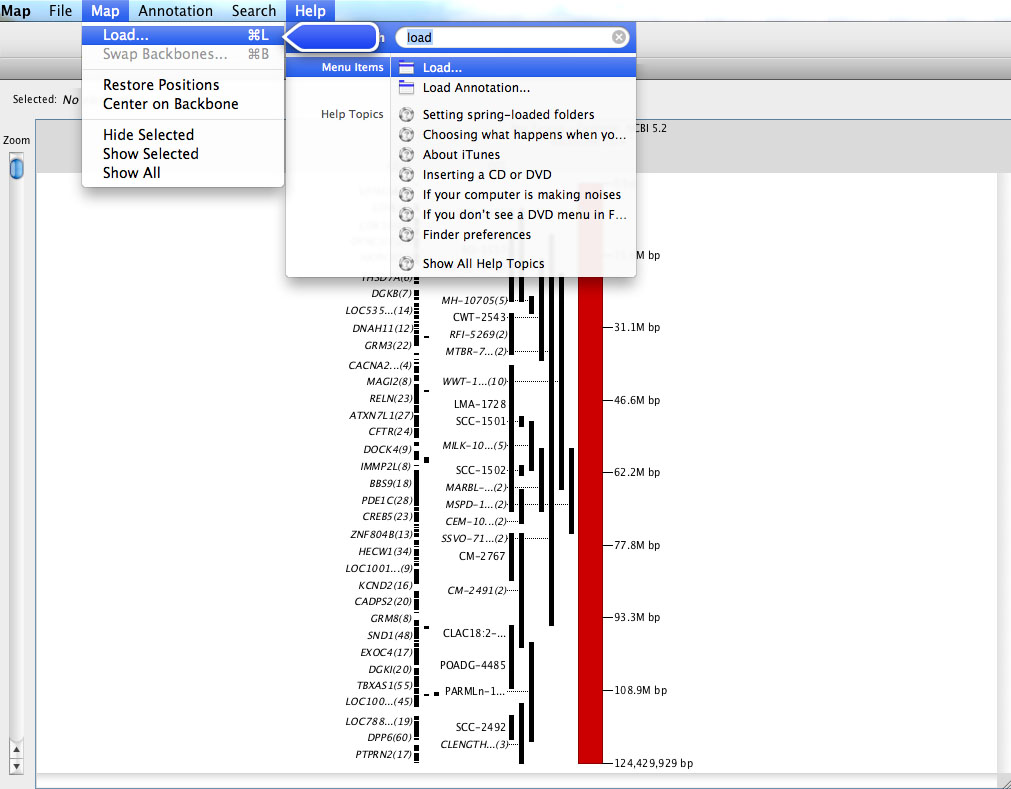
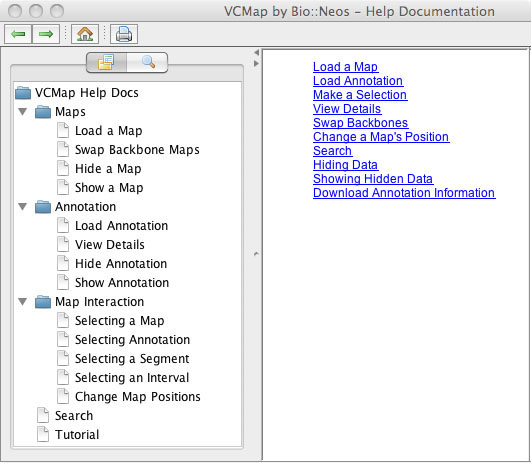
FIGURE 10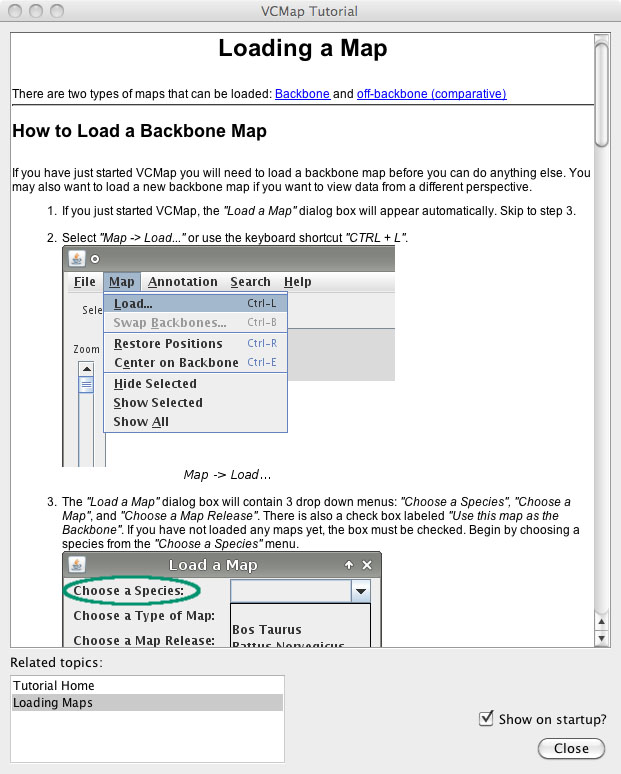 |
K. Limitations on map comparisons:
Only a limited set of map comparisons is possible with the VCMap application, as a result of several factors. First, VCMap allows comparisons only across maps that have UCSC synteny information (net conservation track). When multiple genome builds exist, sometime all builds are not supported by UCSC. This occurs with both older and brand new genome builds when map information is no longer supported or has not yet been processed by UCSC's conservation pipeline. As a workaround for this situation, users can load, supported builds within the same species first as the backbone map, followed by unsupported map builds for that species as an off-backbone map, and then other species off-backbone maps of interest to allow comparisons involving unsupported builds.
III. Example analyses with VCMap
A. Examples of a cross-species comparison
FIGURE 11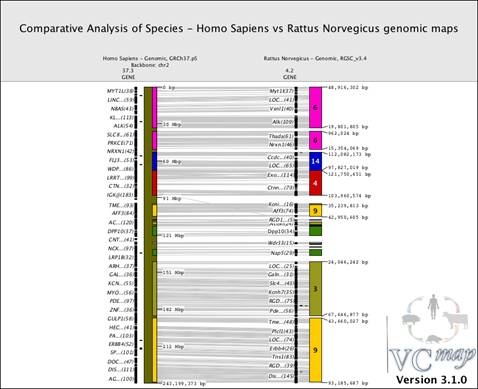 |
Figure 11 shows an example of a comparative view of genomic maps between human chromosome 2 (backbone map) and the syntenic rat chromosomes (off-backbone). Notice the alignment of the multiple rat synteny blocks (multiple colors) directly adjacent to the human chromosome. To visualize this data, a user would select "Load . . ." from the Map menu in the toolbar and then choose Homo Sapiens, Genomic, GRCh37.p5, and click on the option to use this map as the backbone, finally selecting Chromosome 2 from the drop-down menu. After loading the human map as the backbone, the user would return to the map option in the tool bar to select "Load . . . " from the Map menu, choose the "Rattus Norvegicus", Genomic, RGSC_v3.4, and finally selecting "Load" to compare the rat off-backbone map to the human map. Notice this second map is considered as an off-backbone map by default when another species map is already loaded as the backbone map. Finally, to output this image, a user would select "Export Image . . . " from the File menu, and then enter the title, resolution and size of the image desired, as well as the position of the VCMap watermark and the path to save the file.
Comparing Genomic Features
FIGURE 12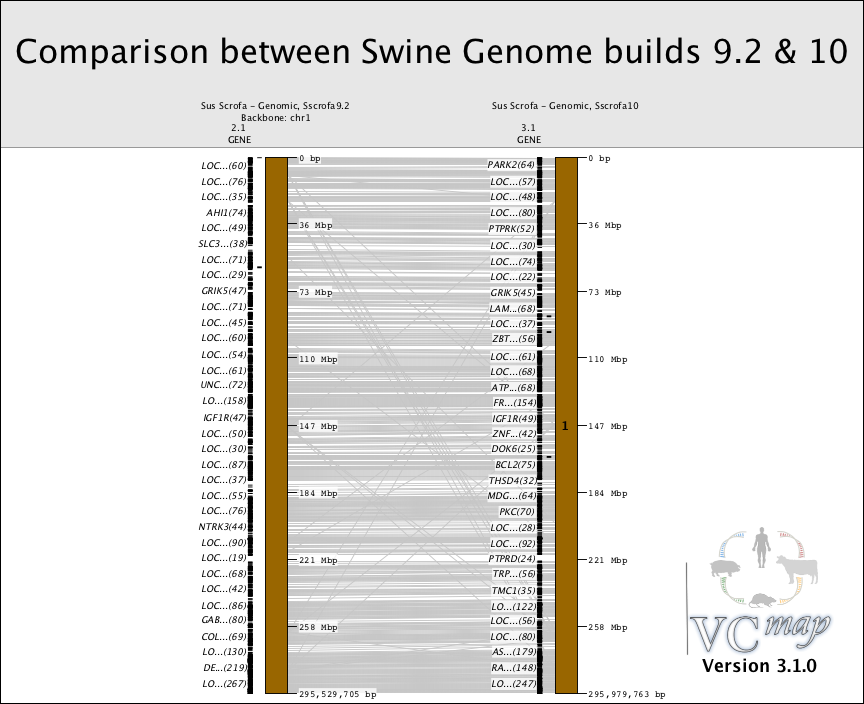 |
Comparing map builds: Figure 12 shows an example of how the order of genes can be compared across map builds in the pig. Notice the gray lines that cross. These lines represent genomic rearrange- ment across builds
FIGURE 13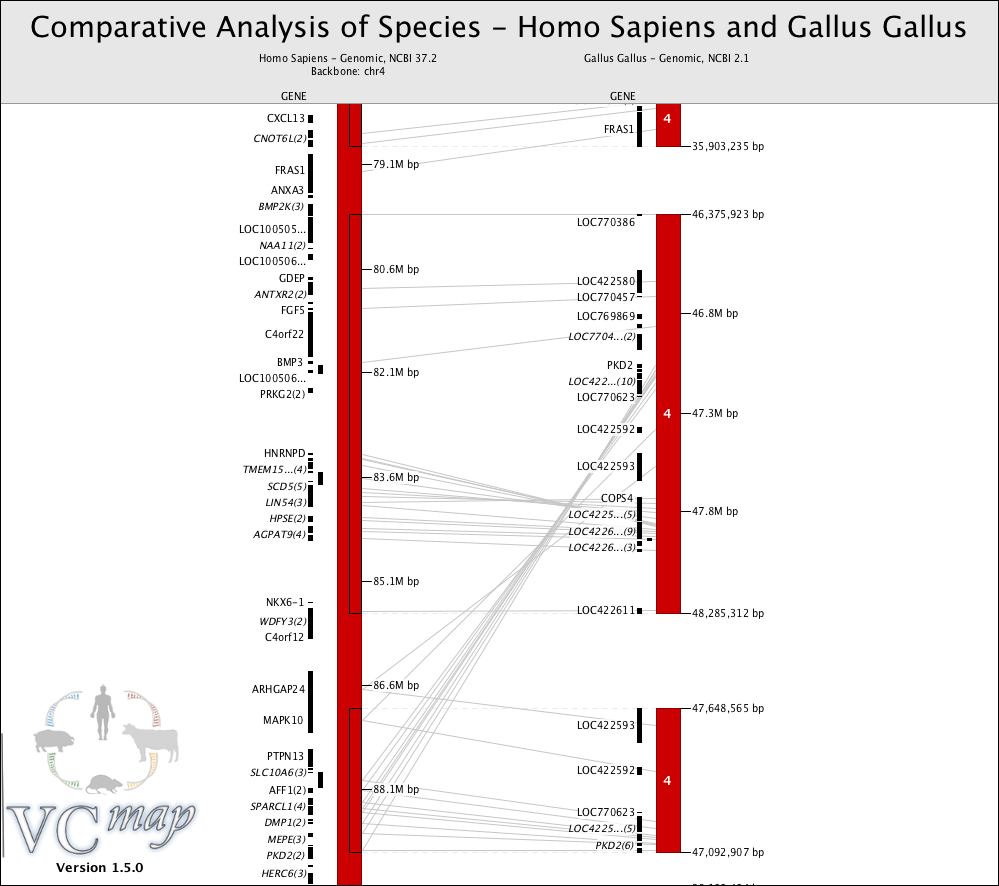 |
Identifying evolutionary duplications: Figure 13 shows a genomic duplication in the chicken genome of the distal portion of human chromosome 4.
FIGURE 14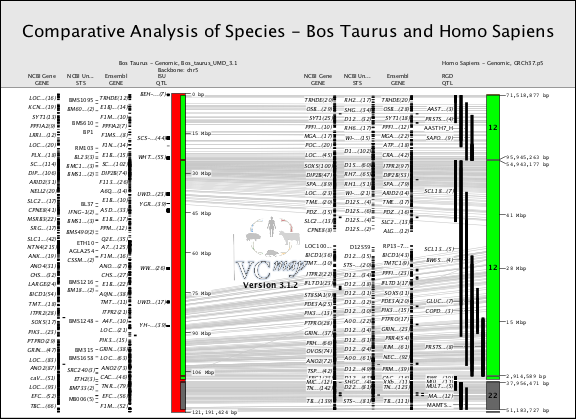 |
B. Viewing Annotations
The example in Figure 14 shows how genes, QTL and STS markers can be viewed within a comparative map example.
FIGURE 15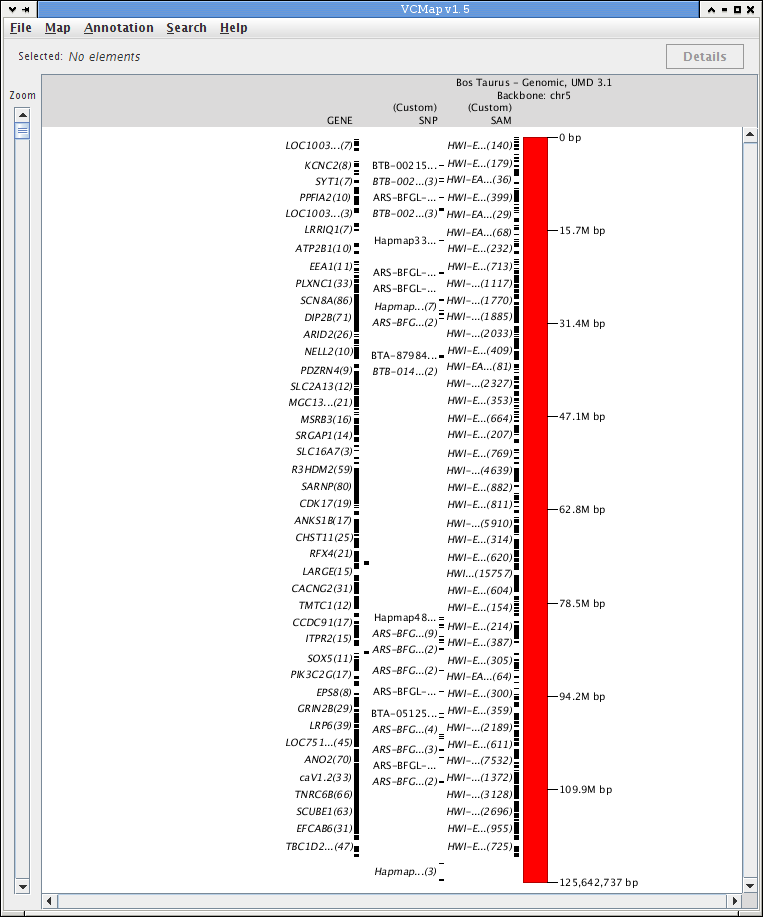 |
C. Uploading Private Data
Figure 15 is an example that demonstrates how private data can be loaded into VCMap. This example shows SNP markers from a GWAS study loaded from a GFF3 formatted filein GFF format as well as single nucleotide variants generated by whole-genome re-sequencing on bovine chromosome 5.
IV. Additional details on the VCMap GUI and database
The VCMap GUI was developed in Java WebStartWebstart for platform independence. The GUI and database were developed in a joint venture by Bio::Neos Inc, Coralville, IA (http://bioneos.com). Additional details related to the functional aspects to the GUI and database design are available in the technical documentation. The technical documentation is intended for users who would like to maintain their own VCMap database and/or are interested in modifying the functionality of the GUI.
V. Troubleshooting common problems
A list of existing problems and solutions for VCmap are listed below. If a new problem is experienced, users can send a help ticket at the following URL: http://www.animalgenome.org/bioinfo/services/helpdesk
To better track problems experienced with VCmap, it is helpful to turn on the “logging” option within the preferences. This will generate an error log that can be sent as part of help ticket for assistance.
A. Problems accessing the database (FIREWALL ISSUES)
VCmap requires an outgoing connection to MySQL to allow communication with the backend database. If users experience errors early during the startup of VCmap, one possible solution is that the application cannot communicate with the database. If you are experiencing problems starting and running VCmap, contact your IT staff to make sure you can access MySQL (port 3306) via your network.
B. Problems with Java installation (OUTDATED JAVA)
On occasion, users have experienced problems with the version of Java installed on their computer. Generally, these problems are noted by errors regarding the Java incompatibility. To overcome this problem, delete all older versions of Java on your machine and reinstall the newest version. At least version 1.5 is required to launch VCMap. Simply installing updates in this situation does not always solve the problem, as older versions of the Java Runtime Environment may still be installed on your system.
C. Updating to a new version of VCMap (OVERWRITING OLD VERSIONS OF VCMAP)
If VCMap is updated, users should delete any old .jnlp files that they have and then modify the Java Preferences on their machine. Within the Java Preferences, under Network, view cache files, users should delete any files with the name VCMap. At this point, users can download and start the new version of VCMap. The version of the software should be checked to make sure that the newest version of the GUI is running by checking the version number at the top center of the GUI window, or selecting “About . . . ” from the VCMap menu on a Mac, or from the Help menu on a PC or linux workstation.
REFERENCES
- Dreszer TR, Karolchik D, Zweig AS, Hinrichs AS, Raney BJ, Kuhn RM, Meyer LR, Wong M, Sloan CA, Rosenbloom KR, Roe G, Rhead B, Pohl A, Malladi VS, Li CH, Learned K, Kirkup V, Hsu F, Harte RA, Guruvadoo L, Goldman M, Giardine BM, Fujita PA, Diekhans M, Cline MS, Clawson H, Barber GP, Haussler D, and James Kent W. The UCSC Genome Browser database: extensions and updates 2011. Nucleic Acids Res 40: D918-923, 2012.
- Hu Z-L, and Reecy JM. Animal QTLdb: beyond a repository. A public platform for QTL comparisons and integration with diverse types of structural genomic information. Mamm Genome 18: 1-4, 2007.
- Park CA, Bello SM, Smith C, Hu ZL, Munzenmaier DH, Shimoyama M, Eppig J, and Reecy JM. The Vertebrate Trait Ontology: A Controlled Vocabulary to Facilitate Cross-species Comparison of Trait Data. In: Plant and Animal Genomes XX Conference. Town and Country Convention Center, San Diego, CA: 2012.
- Petri V, Shimoyama M, Hayman GT, Smith JR, Tutaj M, de Pons J, Dwinell MR, Munzenmaier DH, Twigger SN, and Jacob HJ. The Rat Genome Database pathway portal. Database (Oxford) 2011: bar010, 2011.
- Sayers EW, Barrett T, Benson DA, Bolton E, Bryant SH, Canese K, Chetvernin V, Church DM, Dicuccio M, Federhen S, Feolo M, Fingerman IM, Geer LY, Helmberg W, Kapustin Y, Krasnov S, Landsman D, Lipman DJ, Lu Z, Madden TL, Madej T, Maglott DR, Marchler-Bauer A, Miller V, Karsch-Mizrachi I, Ostell J, Panchenko A, Phan L, Pruitt KD, Schuler GD, Sequeira E, Sherry ST, Shumway M, Sirotkin K, Slotta D, Souvorov A, Starchenko G, Tatusova TA, Wagner L, Wang Y, Wilbur WJ, Yaschenko E, and Ye J. Database resources of the National Center for Biotechnology Information. Nucleic Acids Res 40: D13-25, 2012.